1. Policy failure of the ECB
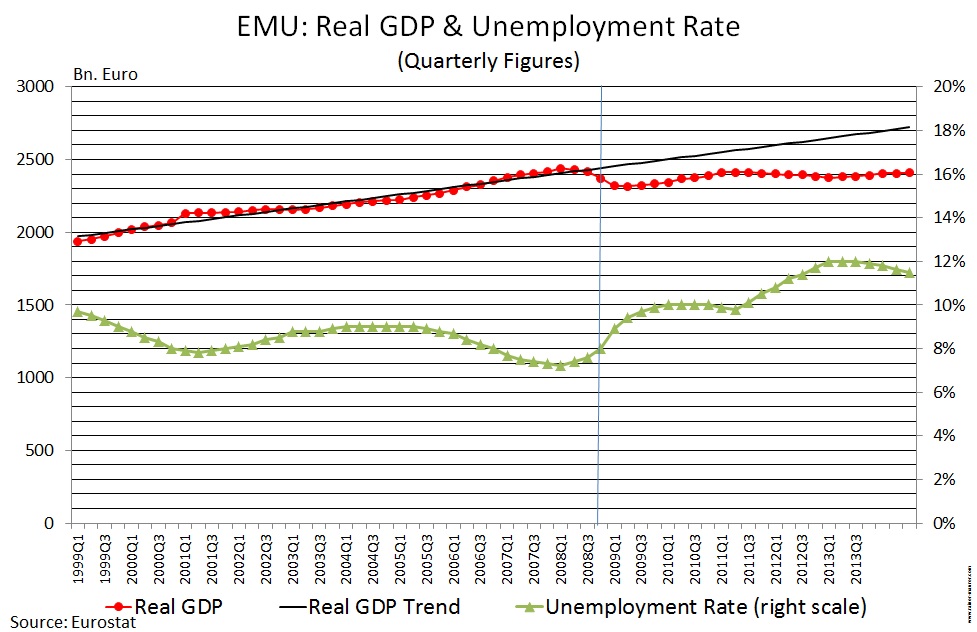
Measured by the deviation of actual GDP from its long-run trend, the economic slowdown in the European Monetary Union (EMU) has begun with the emergence of the Great Recession by the end of the year 2008. (Figure 1). Given this background, it is astonishing, that the monetary policy of the European Central Bank (ECB) has so far not been expansionary, as the following survey of data will show.
Such a policy would be compatible with the view, that the current economic crisis in the EMU is caused by a negative supply-side shock. In this case, however, the expanded asset purchase programm (EAPP) as announced on 2015-01-22, would be superfluous. If one takes however the opposite view, that the current economic crisis is caused by a negative demand-side shock, the EAPP comes too late – in fact much too late. Consequently, in either case, the data hint to a severe policy failure of the ECB.
Figure 1 – Development of real GDP and unemployment EMU vs. USA
– Click diagrams to enlarge –
2. The development of money supply since the beginning of the crisis
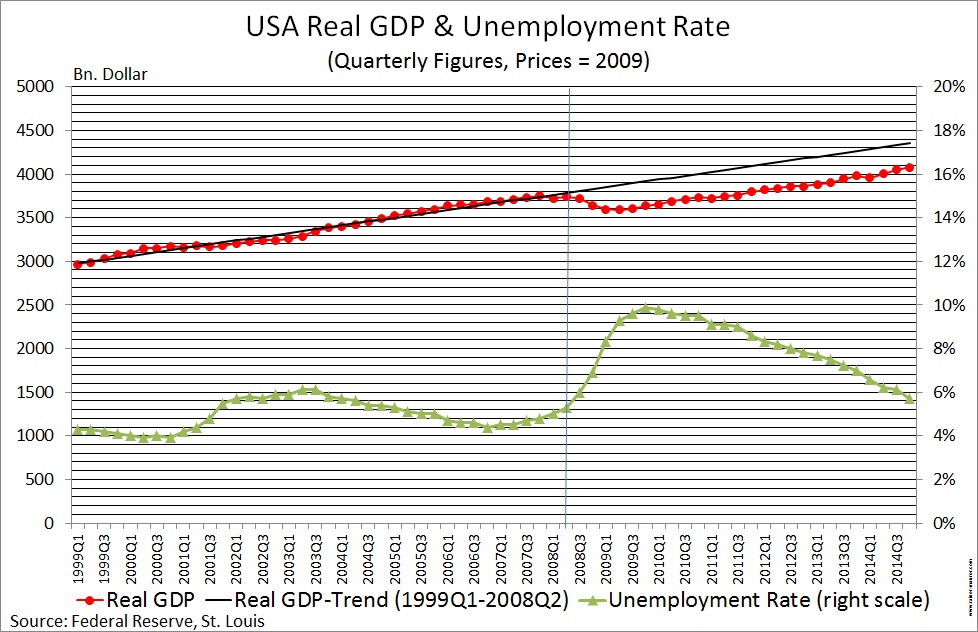
Despite historically low prime rates (figure 2), the increase in effective money supply by the ECB has been significantly lower since the beginning of the year 2008 than its long-run trend (as measured over the period from January 2002, when the Euro was introduced as tangible cash, to September 2008, when the Lehman Brothers bankruptcy triggered the crisis). It has also been much lower than the increase of money supply by the US Federal Reserve (Fed) since 2008 (Figure 3).
Figure 2 – Prime Rates EMU vs. USA

– Click diagrams to enlarge –
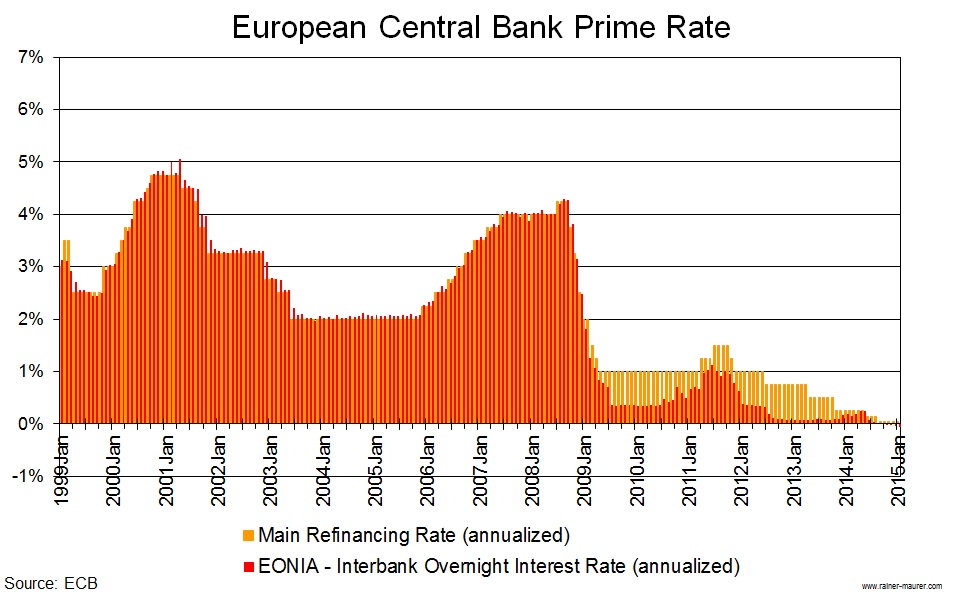
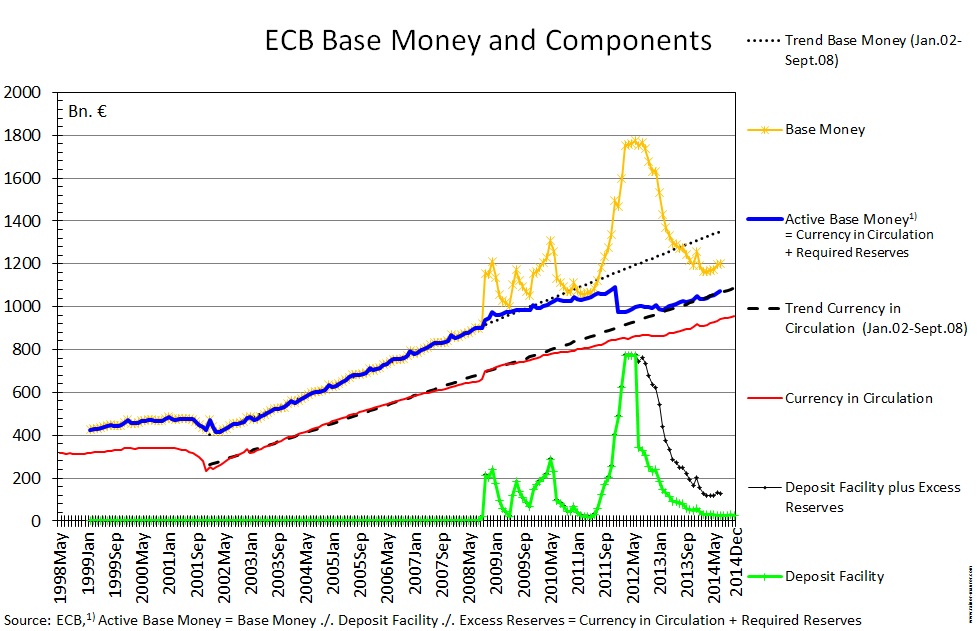
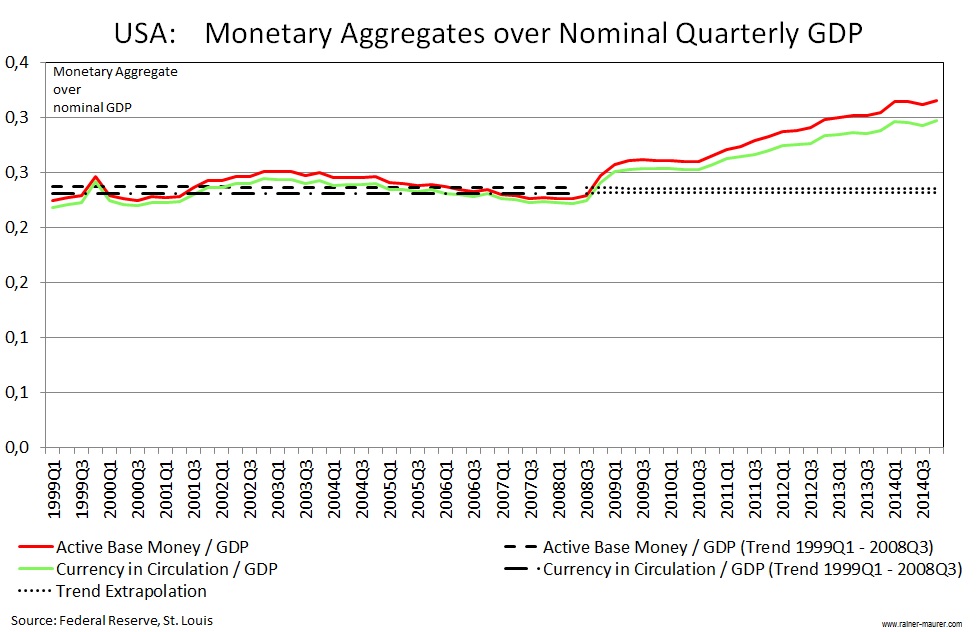
What gained the attention of the public and gave rise to the impression that the ECB injects money into the economy with „big bazookas“ was the balance sheet expansion, caused by an increase of base money supply (= currency in circulation + currency held by commercial banks at the central bank) from summer 2011 to summer 2012 (figure 3). This however was a medium-term intervention necessary to reduce the risk of self-fulfilling bank-runs, raised by the emergence of the European debt crisis. As figure 3 shows, the by far largest part of this increase was held by commercial banks for cautionary reasons in their deposit facility and excess reserve accounts at the ECB. It never became „active base money“ (= base money ./. deposit facility reserves ./. excess reserves = currency in circulation + required reserves); the importance of the difference between „base money“ and „active base money“ has already been discussed in this blog on 2011-12-15 and 2012-10-29). In fact, in the same span of time, active base money supply fell to its pre-crisis level of the year 2008. Currently, it is still significantly below the long-run trend.
Figure 3 – Base Money and Components EMU vs. USA

– Click diagrams to enlarge –
The other event that attracted a lot of public attention was ECB’s president Mario Draghi’s famous „whatever-it-takes“ speech of July 2012 at the Global Investment Conference in London. This statement resulted a couple of weeks later in the OMT-program, that helped to prevent a self-fulfilling run on the government debt of European crisis countries (as explained by Paul De Grauwe (2011)). The success of this program was however so striking that it never caused the expense of a single Euro (as expected in this blog on 2011-12-15).
3. Is the reduction in money supply justifiable?
In general, a reduction in the growth of money supply can be justified by a reduction in the growth of money demand. Standard arguments in money demand functions are interest rates and the volume of monetary transactions. The extremely low current interest rates should, if anything, increase money demand. The reduction of GDP growth could however be an indicator that the growth rate of the transaction volume might have fallen also.
Nominal GDP is a standard indicator for transaction demand. It measures however only trade in newly produced goods and services. In modern economies, a large and growing part of all transactions takes place in already existing stocks of durable goods and financial assets. These are not measured by nominal GDP. Consequently, nominal GDP is at best a lower bound indicator for total transaction demand.
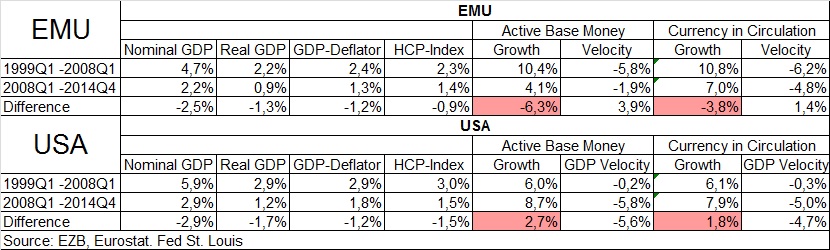
As figure 4 shows, the relationship between the growth of monetary aggregates, GDP and inflation was quite stable before the end of the year 2008 in the EMU as well as in the USA. In the EMU, an average annualized growth rate of active base money of 10,4% was compatible with real GDP growth rate of 2,2% and an inflation rate of 2,5%. In the USA, an average annualized growth rate of active base money of 6,0% was compatible with real GDP growth rate of 2,9% and an inflation rate of 2,9%. According to the quantity equation of money (real GDP-growth + inflation rate = growth of money supply + growth of the velocity of money) this implies a steady decline in the velocity of money of 5,8% a year in the EMU, and of 0,2% in the USA. The differences can be explained by structural differences between both currency areas, like the increased usage of the Euro as a means of payment in countries outside the EMU or a faster growing number of transactions with financial assets and already existing durable goods.
The situation changed after the outbreak of the crisis by the end of the year 2008. Inflation rates and real GDP growth in both currency areas fell significantly, a typical indicator that a negative demand-side shock has hit the economy. A negative supply-side shock causes a rise in the inflation rate.
Figure 4 – Monetary Aggregates over nominal GDP EMU vs. USA

– Click diagrams to enlarge –
A demand-side recession causes a temporary fall in GDP below its full-employment level. If money supply adjusts to a temporary fall in GDP, a recovery, i.e. an increase of transaction demand, will cause a fall in the inflation rate below the target inflation rate. Consequently, in a demand-side recession, the ratio of money supply over nominal GDP should grow but not fall, if a central bank targets a specific inflation rate. Figure 4 shows however that in the EMU the ratio of active base money and currency in circulation over nominal GDP have fallen below long-run trends. In the USA the opposite has been the case.
However, base money supply by the central bank, offered as a credit to the economy, is only one component of total money supply generated by the central bank. If deposit credits granted by commercial banks, can be used as a means of payment, such that only a fraction smaller than 100% is withdrawn in cash from deposit accounts by the non-banking sector, the total credit supply of commercial banks, M, based on base money supply, B, can be larger than base money supply, i.e. M > B if M * (c + r) = B and 0
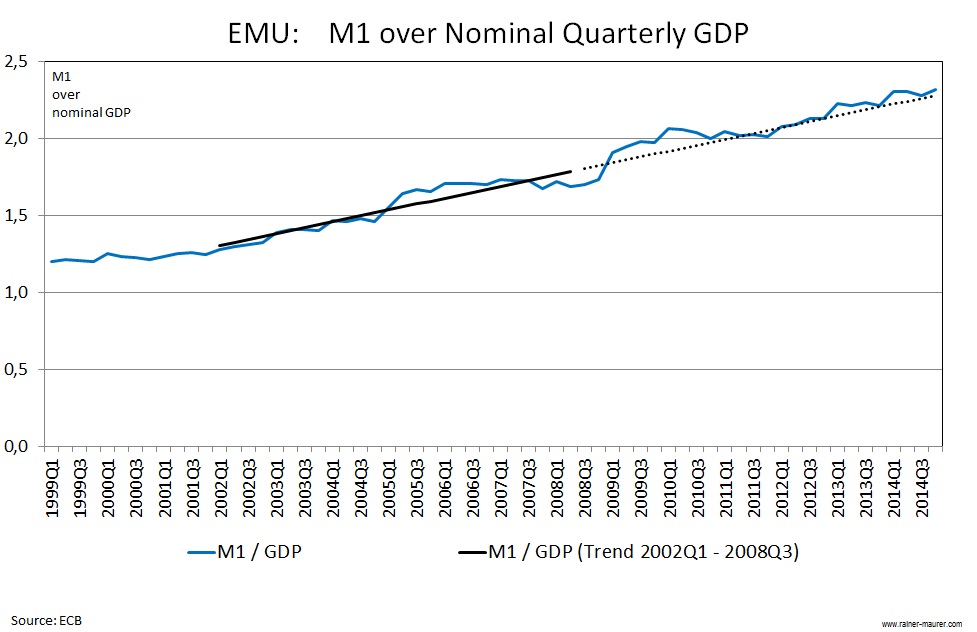
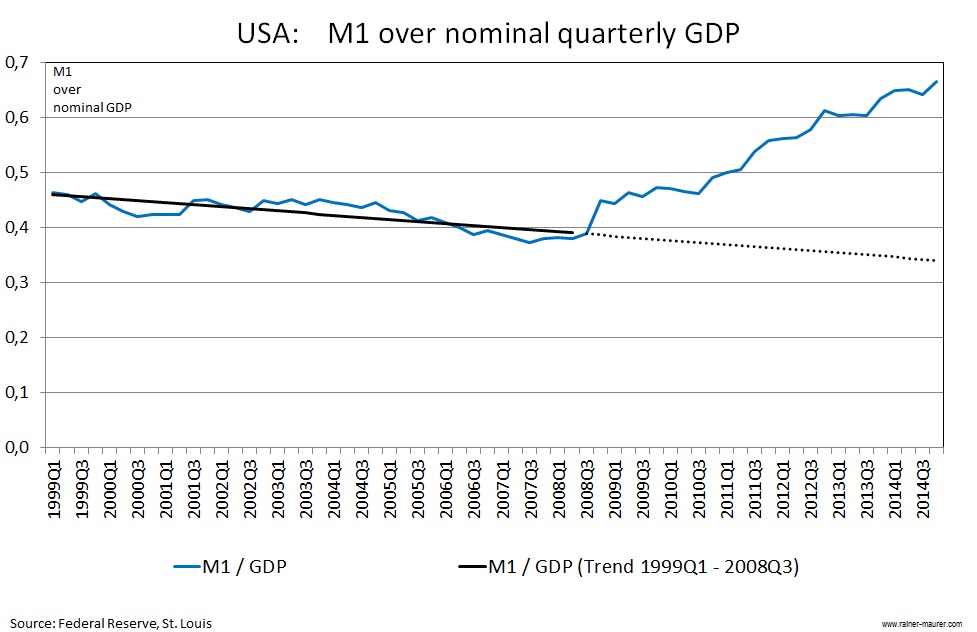
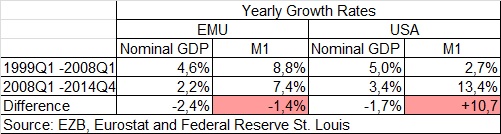
Figure 5 shows that the relation of M1 over nominal GDP in Europe since the year 2008 roughly followed the long-run trend, while in the USA the increase of M1 over nominal GDP was significantly above the long run trend. Since however GDP growth has fallen in the EMU since 2008, this implies that M1 growth must have fallen too. This conclusion is confirmed by the table below the diagrams.
Figure 5 – M1 over Nominal GDP EMU vs. USA
– Click diagrams to enlarge –
4. Consequences for credit supply
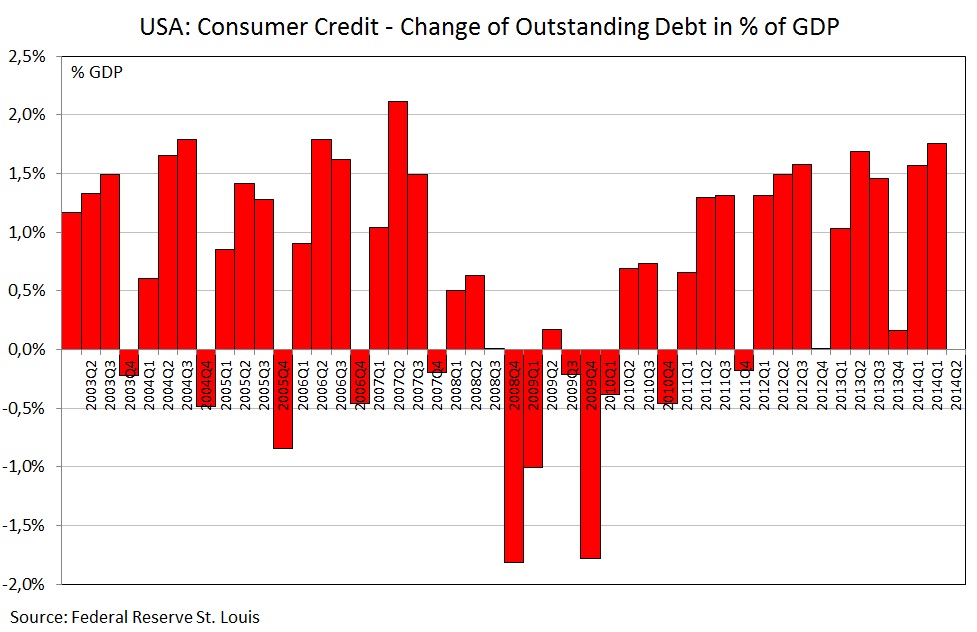
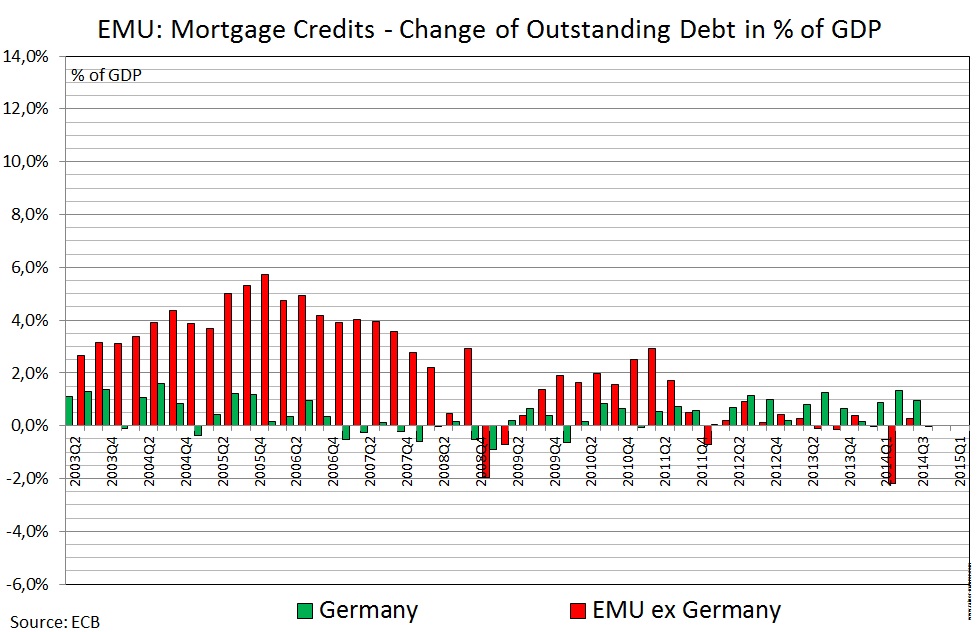
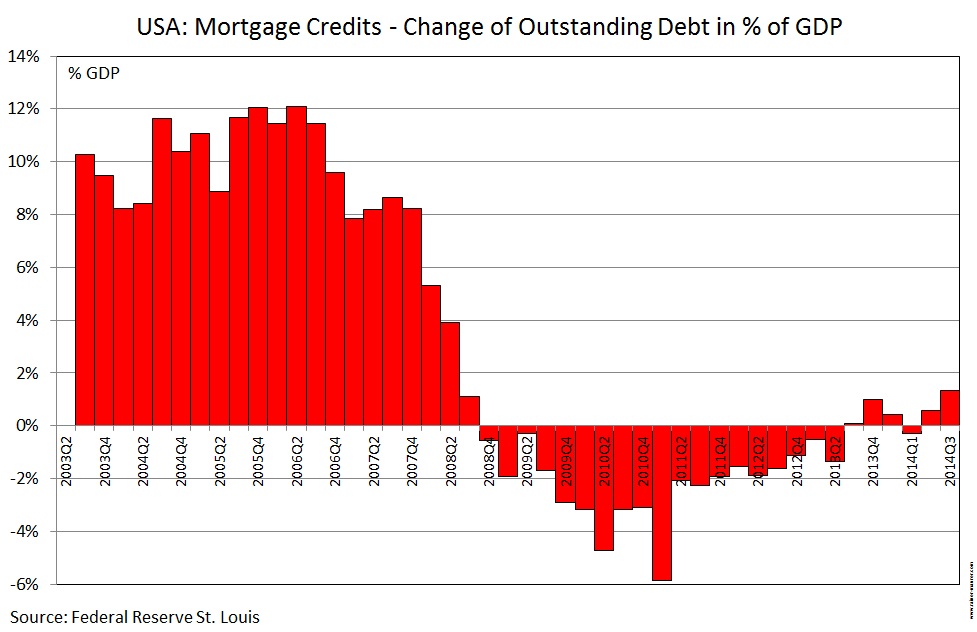
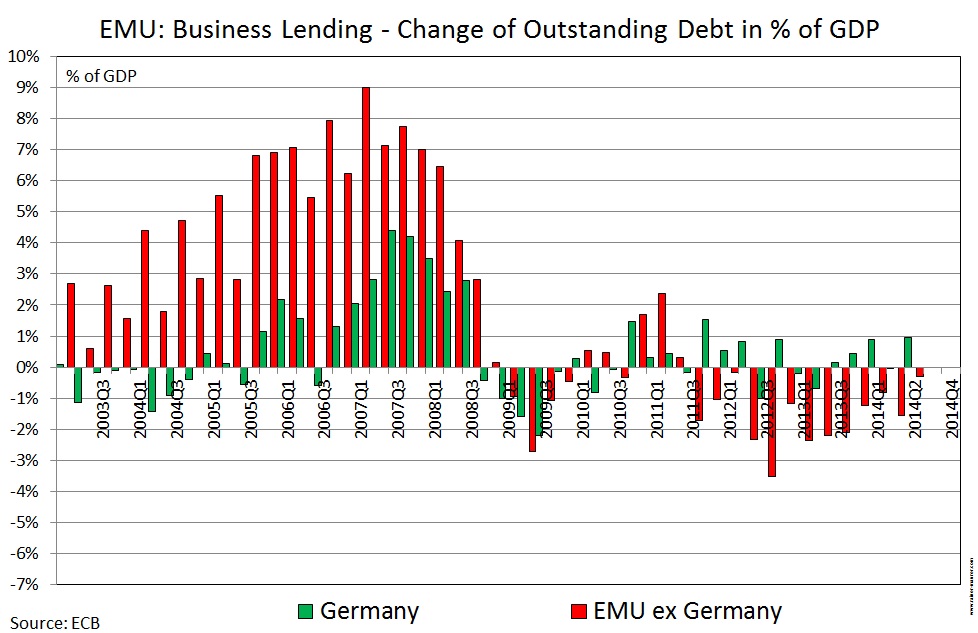
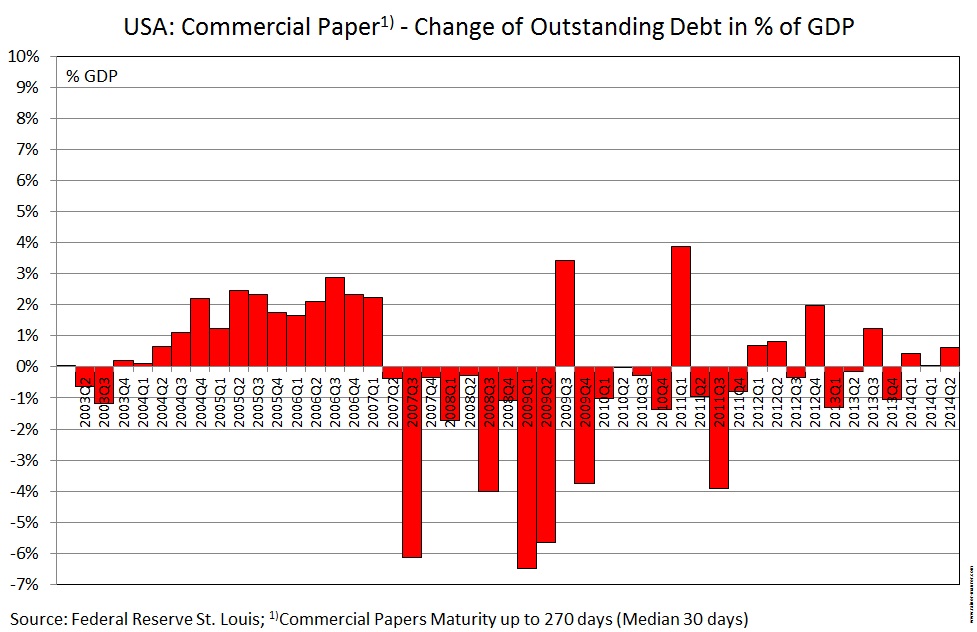
Consequently, it is fair to say that so far the ECB policy reaction towards the economic crisis since 2008 was restrictive – if this crisis was caused by a demand side shock. At least, it was by no means expansionary. This view is also supported by the development of the major segments of the credit market, displayed by figure 6:
Figure 6 – Credit Growth EMU vs. USA

– Click diagrams to enlarge –
For the US economy the most important credit market segment is the consumer credit market; for the EMU the most important segment is the market for business lending to non-financial corporations. As the diagrams show, the US market for consumer credits is back to pre-crisis lending levels, while the EMU market for business lending is still far below pre-crisis levels. This holds also for the consumer credit market and the mortgage credit market in the EMU. In the US, the mortgage credit market has not reached its bubble-driven pre-crisis levels, but found back to positive net-lending volumes. In the EMU net lending volumes for mortgage credits are still significantly below their pre-crisis levels.
Figure 7 indicates that gross investment demand, the component of total demand that is typically strongest affected by business cycle fluctuations, is currently recovering in the US, while in the EMU its share in total GDP still displays a significant downward trend. This corresponds to the above finding that the EMU market for business lending has not yet stabilized. For the US, business lending is less important for investment activities, since private companies finance the largest part of investment via stock and private equity markets.
Figure 7 – Investment Demand EMU vs. USA

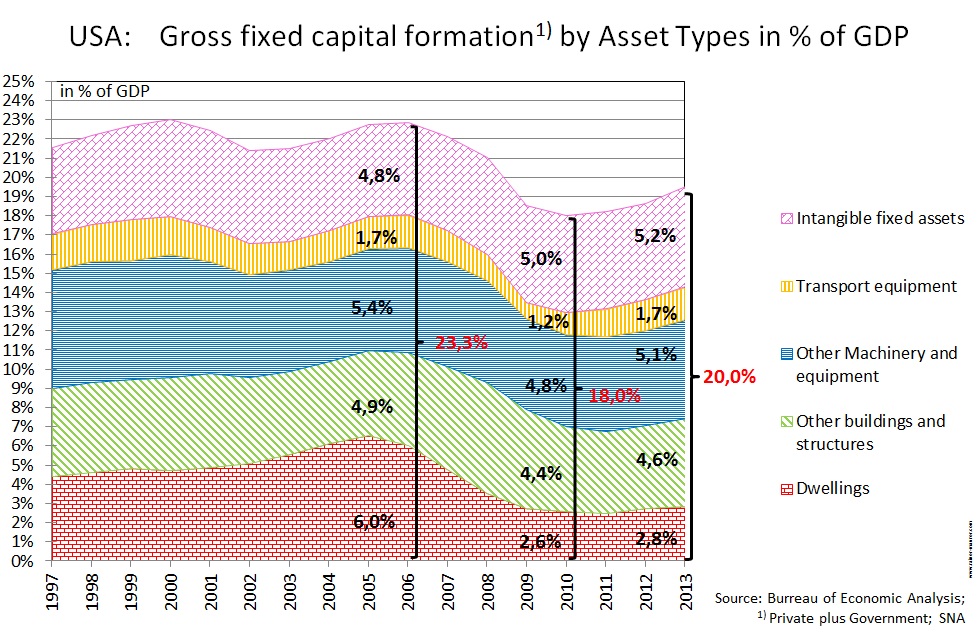
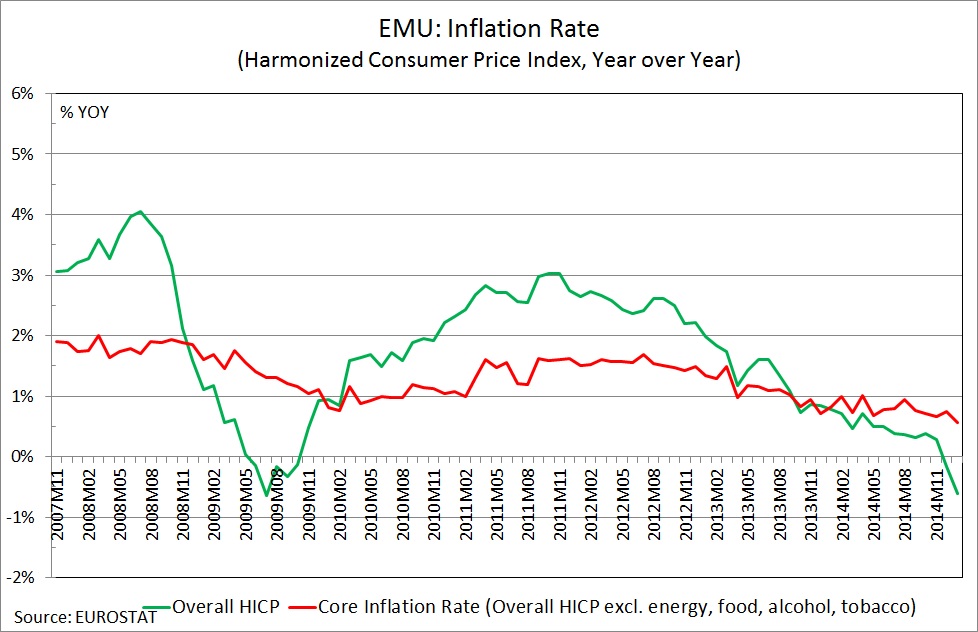
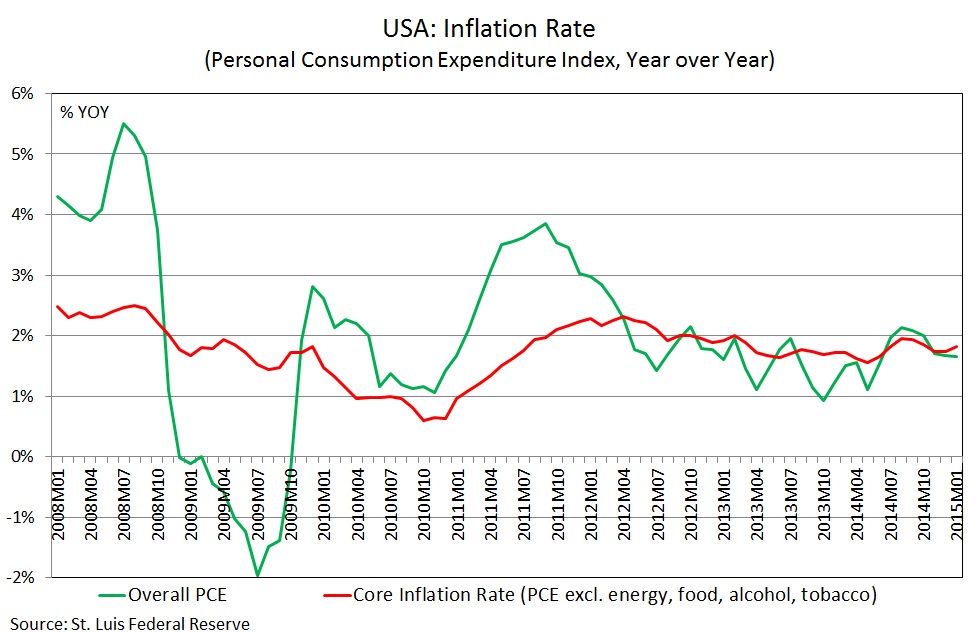
Figure 8 summarizes the consequences of all this for the inflation rate. The US inflation rate is close to its medium term target rate of 2%, the EMU inflation rate is significantly below its target rate of „below but close to 2%“ – measured by the overall HCPI as well as by the core HCPI. The comparison shows that the argument, the very low EMU inflation rates were caused by declining energy prices is not plausible, because the US economy certainly profits even more from lower energy prices. The missing of the EMU inflation target is the result of a monetary policy that has not been expansionary enough.
Figure 8 – Inflation Rats EMU vs. USA
– Click diagrams to enlarge –
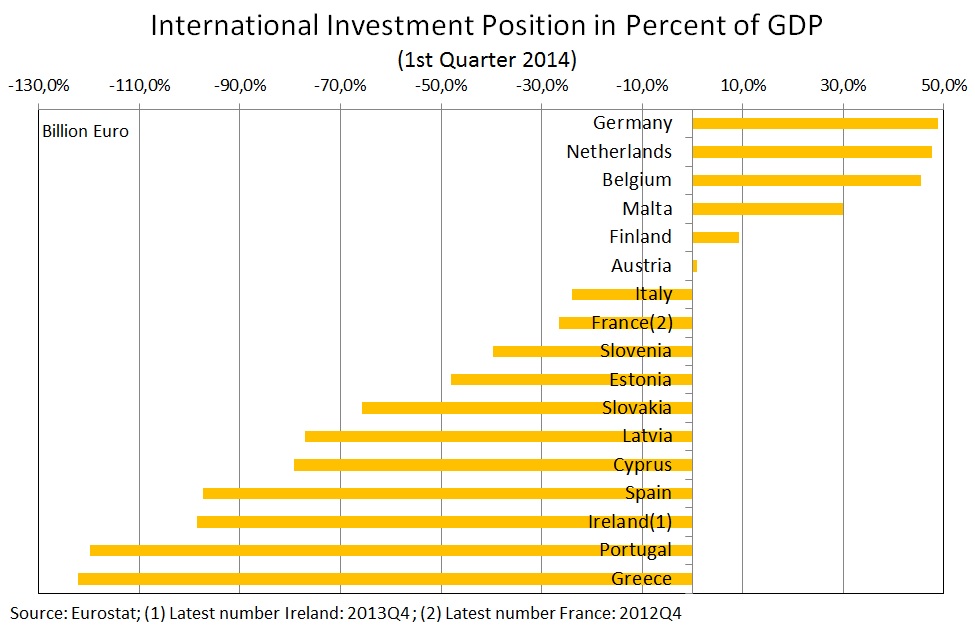
An inflation rate that is lower than expected implies a real interest rate higher than expected. This is a windfall profit for net creditor member states at the expense of net debtor states. Hence missing the EMU inflation target always implies a redistribution of real income between member states. Net creditor countries have an incentive to favor an undershooting of the inflation target and vice versa. It is therefore highly doubtful that the correlation between the International Investment Position (Figure 9) of member states and the voting behavior of their representatives in the ECB Council is mere coincidence.
Figure 9 – International Investment Position of EMU Countries
– Click diagram to enlarge –
5. Failing convergence of price levels
Missing the official inflation target is one big problem of the EMU. The other big problem is the insufficient convergence of price levels. Since the beginning of the crisis, convergence is only observable, if one includes the deflationary episodes of Ireland and Greece (Coefficient of Correlation, continuous line). Without these countries, the degree of divergence still rests on the same level as before the crisis (Coefficient of Correlation, dashed line).
Figure 10 – EMU Inflation Divergence

– Click diagram to enlarge –
The divergence of price levels is the major reason for the divergence of unit labor costs. As demonstrated in this blog on 2012-10-21, it is possible to proof, without any empirical assumptions, the following impossibility theorem: „If the inflation rate is larger than zero, it is not possible to keep both constant, unit labor costs and the wage share in GDP.“ The proof follows from the definition of unit labor costs and the wage share in GDP. According to the definition of unit labor costs, constancy of unit labor costs between to periods requires (shortcuts here):
![]()
Rearranging terms shows that nominal wages must grow with real labor productivity growth only, in order to keep unit labor costs constant:
![]()
According to the definition of the wage share, constancy of the wage share between period t and t+1 implies:
![]()
Rearranging the terms shows that – in order to keep the wage share constant – nominal wages must grow with real labor productivity growth plus the inflation rate:
![]()
Consequently, it is not possible to keep both figures, unit labor costs and the wage share, constant, if the inflation rate is larger than zero, Pt+1 / Pt > 1: If full compensation for inflation plus the rise in labor productivity is paid, the wage share in GDP will stay constant, but unit labor costs will grow; if no compensation for inflation but only the rise in labor productivity is paid, unit labor costs will stay constant, but the wage share in GDP will fall. The latter implies a redistribution of GDP from working-class households to capital owner households. Consequently, a „distributionally neutral“ wage policy implies rising unit labor costs in the presence of above zero inflation rates.
For a currency union with diverging inflation rates of member states, this implies diverging unit labor costs, if the wage policies in all member states remain distributionally neutral: High-inflation countries will experience a stronger growth of unit labor costs than low-inflation countries. Diverging unit labor costs in a monetary union imply however – contrary to diverging unit labor costs in a system of flexible exchange rates – diverging competitiveness of member states. In a system of flexible exchange rates this will not necessarily happen, since the purchasing power parity mechanism will tend to depreciate the exchange rate of high inflation countries and vice versa. In a monetary union however, no such market driven „counterbalance valve“ exists.
The ECB can therefore not neglect the problem of diverging inflation rates. The myth of a „uniform monetary policy“ for all member state is the constructional flaw of the EMU. The idea that the ECB targets the average inflation rate across all member states, and the member states themselves use fiscal or regulatory policies to keep the individual inflation rate of their country close to the target rate, is politically not viable. The time horizon of democratic governments is typically to short to let them fight economic booms voluntarily. For independent central banks, this is much easier. The tools the ECB can use within the current policy framework to implement country-specific monetary policies are country-specific refinancing rates or country-specific minimum reserve requirements, as proposed here.
The consequences of missing the target inflation rate in a heterogenous way on the level of member states for the competitiveness of the member states leads to a „memory effect“: If there is an overshooting of the actual inflation rate above the target rate in period t, the resulting deterioration of competitiveness will hold on in the following period t+1, even if the inflation target is met in period t+1. In other words, missing the inflation target, in one period, will not be „forgotten“ in the next period. It is therefore questionable, whether the targeting of an inflation rate is an appropriate strategy for the EMU at all. The targeting of a price level, extrapolated with a target inflation rate, would prevent the memory effect.

Ah, but the US unemployment rate (U3) is distorted by the large number of discouraged workers who have left the workforce: the U6 unemployment rate is more like 11.3% for Jan 2015…but at the end of the day that doesn’t change the fundamental message you’re saying: it’s a mess. :-)
Nevertheless, John, there is some improvement in U6 too:
http://www.macrotrends.net/1377/u6-unemployment-rate
How would U6 for the EMU look like?
Maybe, we do not really want to know that…